Finally, Zabbix 3
// Publicado em: 4 de fevereiro de 2016As defined by Wikipedia, Zabbix is an enterprise open source monitoring solution for networks and applications, created by Alexei Vladishev. It is designed to monitor and track the status of various network services, servers, and other network hardware. It is released under GPL and backed by a company named Zabbix.
The first stable version came out in March 2004, Zabbix 1.0. Since then, a lot of improvements has been made and, in January 2016, the first Zabbix 3 beta version was released to the public.
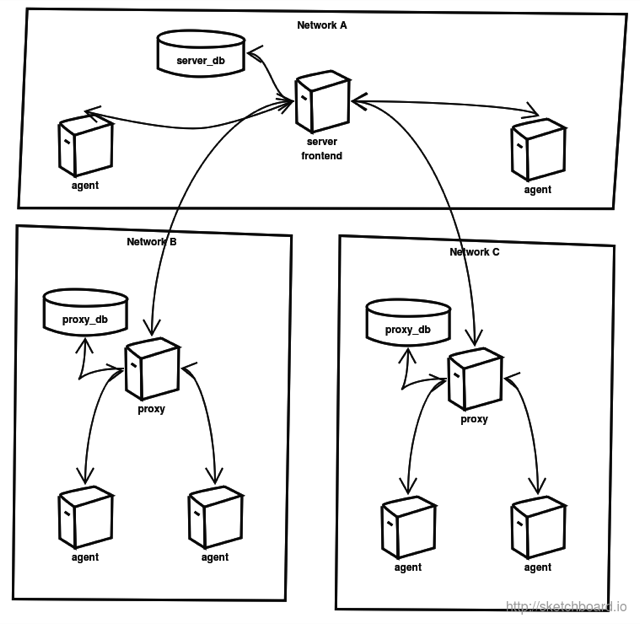
Zabbix Architecture

Zabbix Architecture
The Zabbix-way of monitoring is actually simple, and its architecture is easy to understand, composed by:
- Server: Written in C, the Server is the central component. It retrieves data, calculate triggers, send notifications etc. All its data is stored in a database, supporting MySQL, PostgreSQL, SQLite, Oracle or IBM DB2.
- Server Frontend: Web application written in PHP and JavaScript, used to configure almost all Zabbix configurations and and to analyse all collected data.
- Proxy: Used when the Agent can’t reach the Server directly. The proxy recieves data and forwards to the Server. Also stores its data in a database.
- Agent: Installed in a OS to get information about local resources and applications (storage, CPU, memory). Communicate to a Server or Proxy. See supported plataforms here.
- Java Gateway: Is a daemon written in Java to monitor JMX applications, available since version 2.0.
Noneless, Zabbix further can monitor through ICMP, SNMP, SSH and Telnet. You can too write custom modules to send data from the Agent or pull from the Server or Proxy.
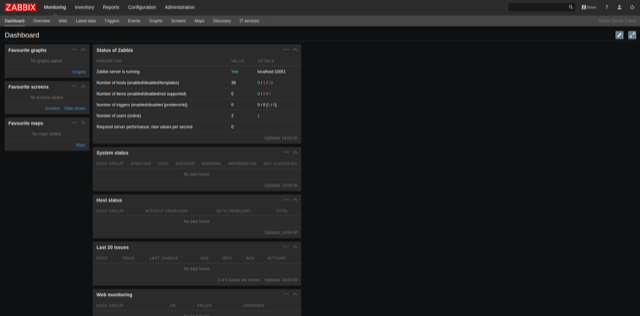
The Zabbix 3

Zabbix 3 Dashboard
Alexei Vladishev tweeted about an early preview in last June, but it was possible just in 21/12/2015. Since this date, Zabbix got two alphas, two betas and yesterday its first release candidate.
This new version maitains its architecture, but introduces brand new features and improvements in usability and performance.
What’s new?
You can see all new features in Zabbix 3 in the documentation page or the release page.
In my humble opinion, I listed the biggest changes:
- Frontend Redesign: IT LOOKS BEAUTIFUL! The look and feel provided by the old web frontend was like websurfing in mid 2000’s. Now, the monitoring power is combined with a good and smooth web application.
- Encyrption and Authentication: All traffic between Server-Proxy-Agent is supported (but not default) out of the box. No need to VPN anymore.
- Forecasting and Trend Prediction: Zabbix should now try to predict resource utilization in the future, telling when values will reach its threshold.
- Sharing: Possibility to share maps, screens and slideshows.
- Item Scheduling:Items can be schedule to run at a certain time and it can be defined one by one.
- Performance Improvements: Optimizations in code allowed improvements by 1/3 in the number of poller configuration cache.
Getting Zabbix 3
Yet in release candidate, Zabbix 3 does not have installation packages, it must be installed by code compiling. You can follow the installation steps here.
Zabbix offers a virtual appliance ready to deploy and test. It has Server (MySQL or PostgreSQL) and Proxy (MySQL and SQLite3), based in an Ubuntu 14.04 image, supporting most hypervisors. You can get it in the appliance page.
Also, I developed an Ansible Role to install and configure Zabbix Server, Proxy and Agent in a Debian-like system. You can get it in Ansible Galaxy. Let me know if you test it out and want some improvements!
Resources and Community
Great, right? Zabbix is an awesome tool and it is getting awesomer in each release. Wanna learn more? You can get more information in the documentation page.
Nice books to read are Mastering Zabbix (2013), Zabbix Cookbook (2015) and Zabbix Network Monitoring Essentials (2015).
As Joseph Ruscio said, It’s not in production unless it’s monitored.